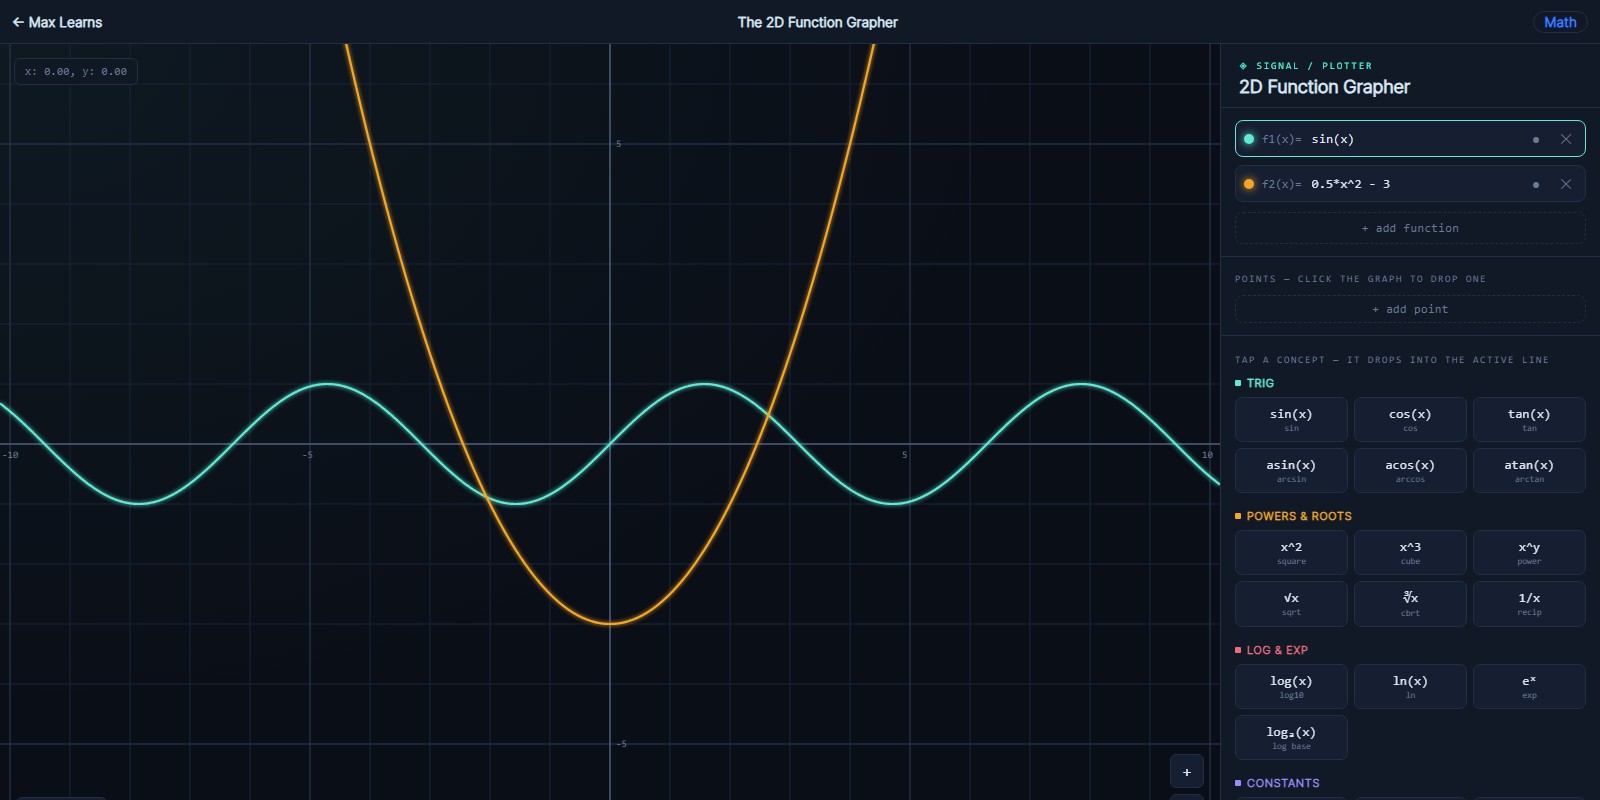
The 2D Function Grapher
Graph any function and see how its shape changes
type a function and watch it graph, drag points, zoom around the curve
what this teaches: functions, graphing, algebra
What you'll learn
- How changing one coefficient changes the shape of a graph
- What the x-intercepts, y-intercept, and turning points of a curve look like
- How to read a function's behavior from its picture rather than its formula
- That every equation has a shape, and every shape has an equation
How to play
- Type a function into the box. Something like x^2 - 3 is a good first try.
- Watch it draw, then drag the graph to move around and scroll to zoom.
- Change a single number in the function and plot it again to compare.
FAQ
What age is this for?
Around age 10 and up. Anyone who has met the idea of x and y on a grid can use it, and it stays useful through Algebra 2 and precalculus.
What can I type?
Standard algebra and trigonometry notation. If something does not plot, check for a missing bracket or a missing multiplication sign first.
Do I need to install anything?
No. It runs in any web browser, it is free, and there is no signup or account.
For parents and teachers
The value here is the speed of the feedback loop: change one number, see the curve move. That link between symbol and shape is what makes later algebra click, and it is slow to build from a worksheet. Use it alongside a graphing unit rather than instead of one.
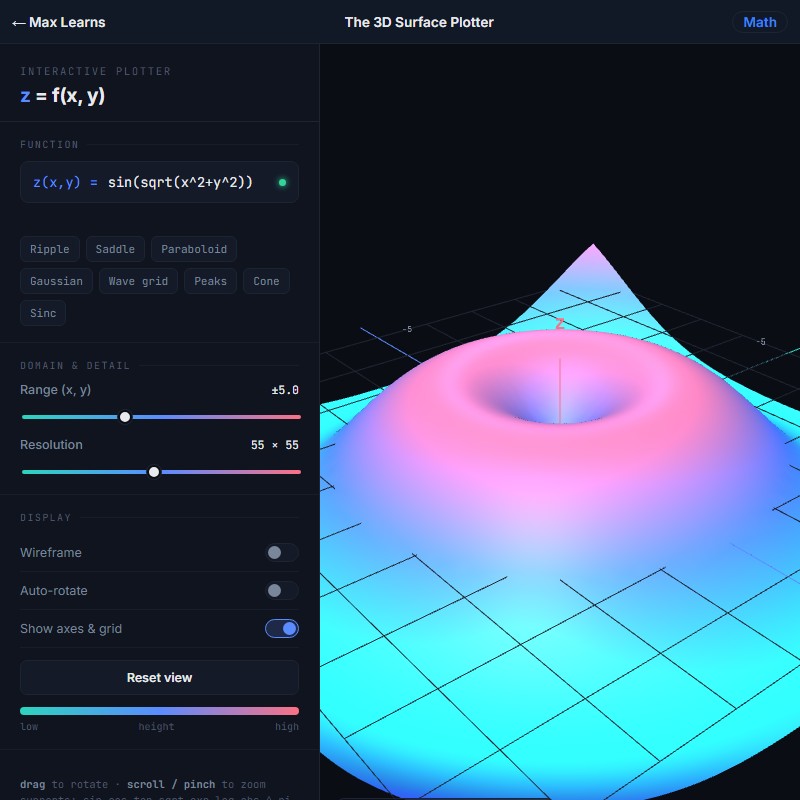 The 3D Surface Plotter
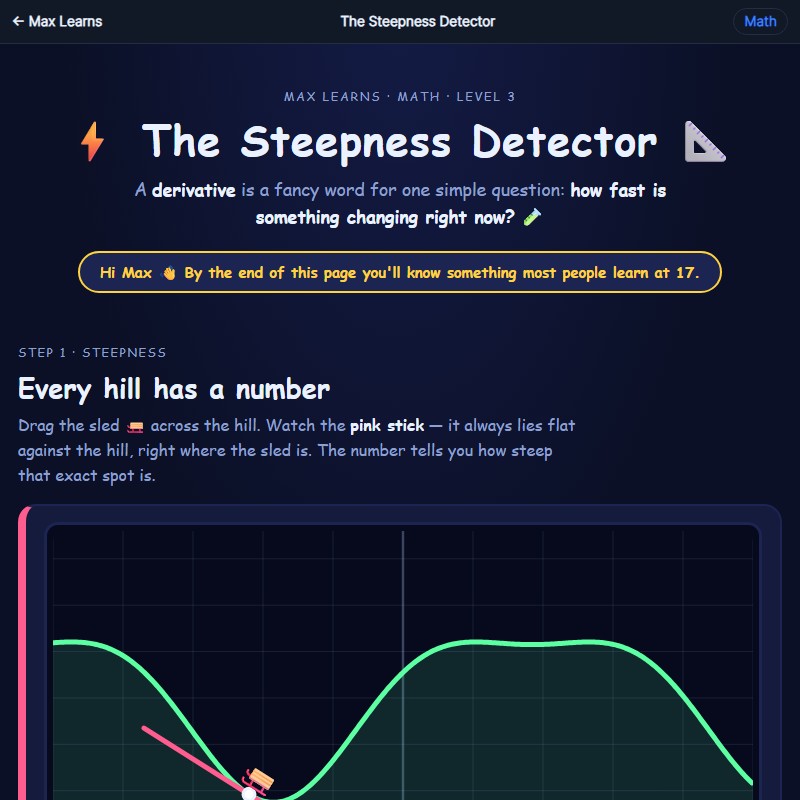 The Steepness Detector
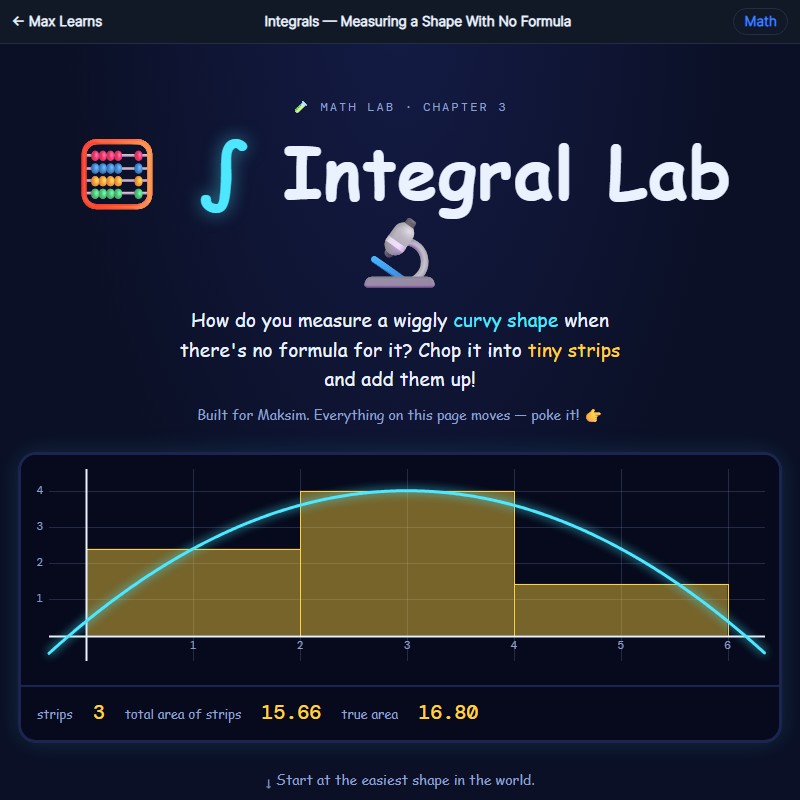 Integrals — Measuring a Shape With No Formula